When using virtualization of any kind you introduce a layer of abstraction that people in operations need to deal with, i.e. if you run a couple of virtual machines on a physical server you need to be able to understand the impact that changes (or failures) in one layer have on the other. The same is true for network virtualization, we need to be able to understand the impact that say, a failure of a physical router port, has on the overlay virtual network.
To make this possible with Nuage Networks we can use our Virtualized Services Assurance Platform or VSAP for short. VSAP builds upon intellectual property from our parent company, Alcatel-Lucent (soon to be Nokia), using the 5620 Service Aware Manager as a base to combine knowledge of both the physical and virtual networks.
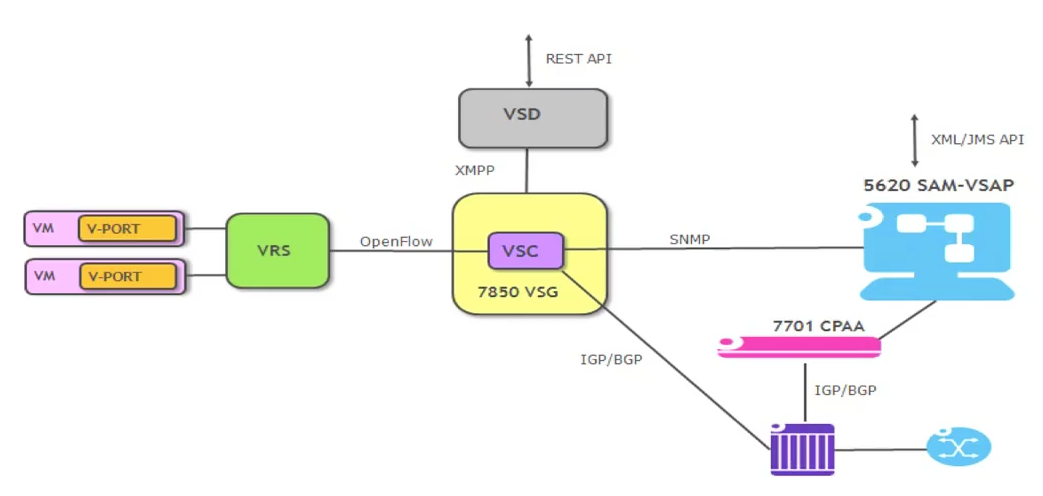
VSAP Key Components
VSAP communicates with Nuage Networks using firstly SNMP, connecting into the Virtualized Services Controller (VSC, the centralized SDN controller) this gives VSAP an understanding of the network topology in the Nuage SDN solution. Secondly it uses a CPAM (Control Plane Assurance Manager) module via the 7701 CPAA which acts as a listening device in the network to collect all the IGB and BGP updates which allows it to model the underlay network based on IGP.
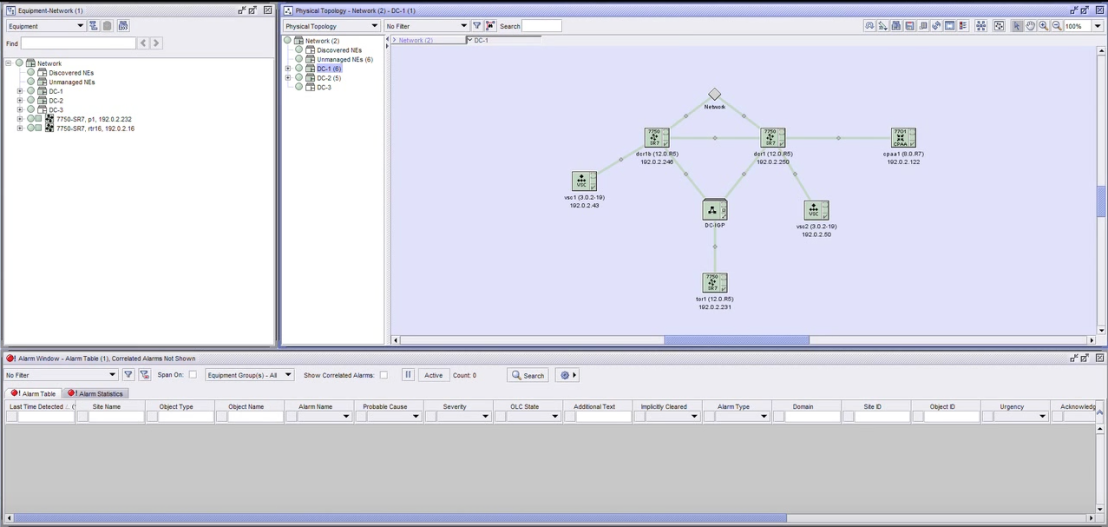
The solution has both a both a Web GUI and Java GUI, pictured below is the SAM JAVA GUI which in this example is displaying the physical network including the data center routers, the VSCs, and the Top-of-Rack switches. (again all learned via SNMP).
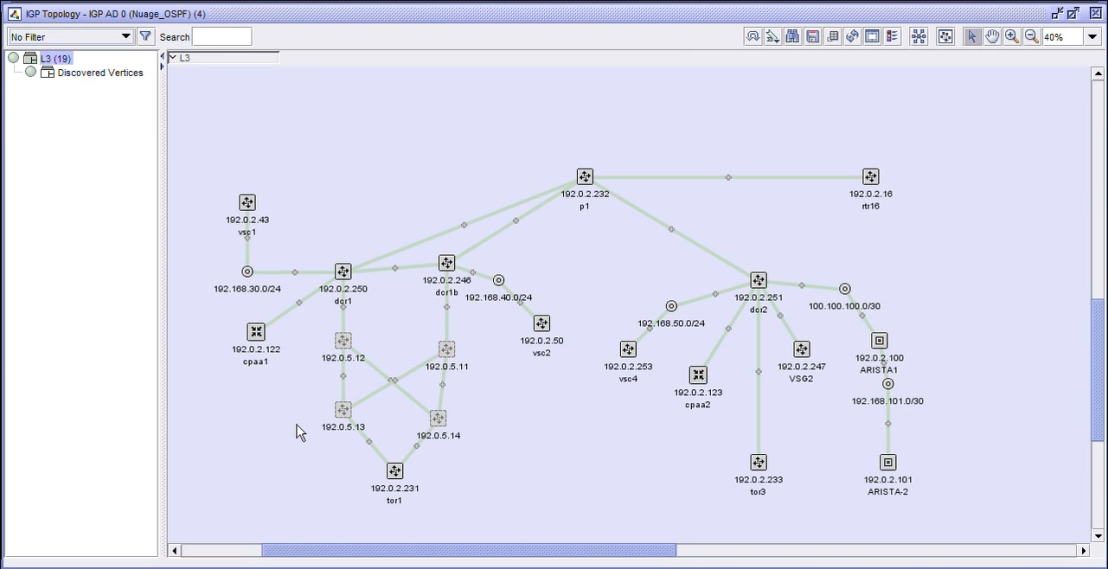
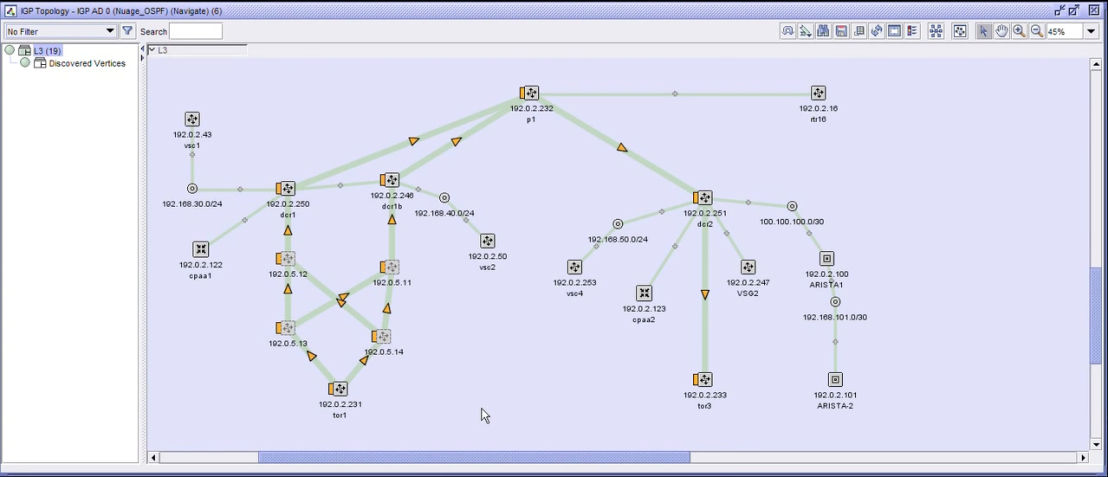
You can also look at the IGP (in this case OSPF) topology (picture below), again this is build by the CPAM based on the routing information in the network. We can use this model to map the underlay (what you see on the picture below) with the overlay information from the Nuage Networks SDN solution.
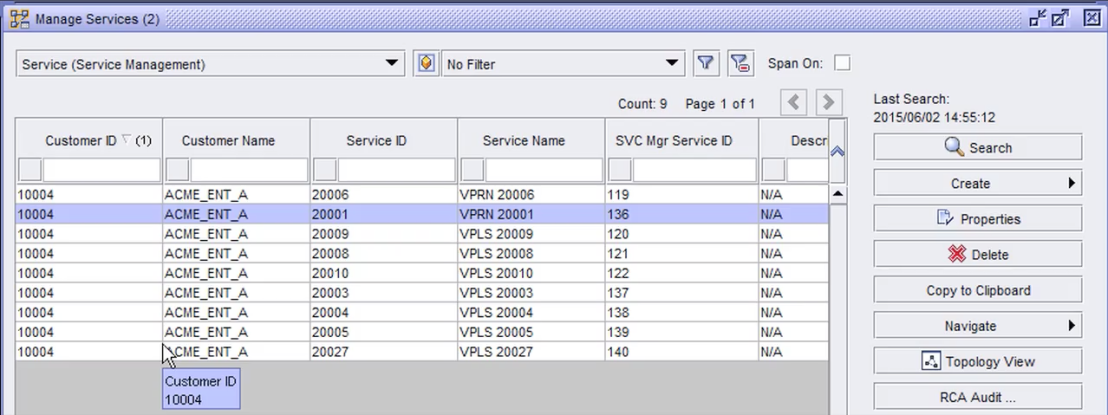
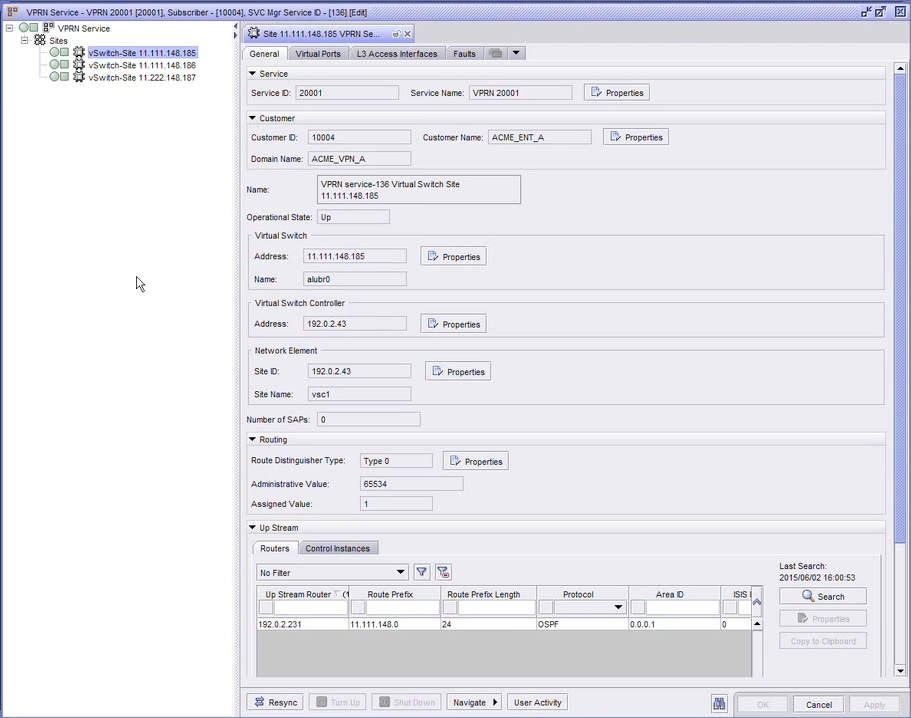
You can also get a closer look at the services in the network, in the example below the VPLS (L2) and VPRN (L3) constructs. These services are created by the Nuage Networks SDN solution.
We can also drill deeper into the Virtual Switch constructs provided by Nuage (for example to see which virtual ports and access ports are attached, or which faults recorded are at the vSwitch level,…)
You can also see how traffic is passed across the virtual service, you have an option to highlight it on the IGP topology view and see the superimposed virtual service on top of the physical underlay.
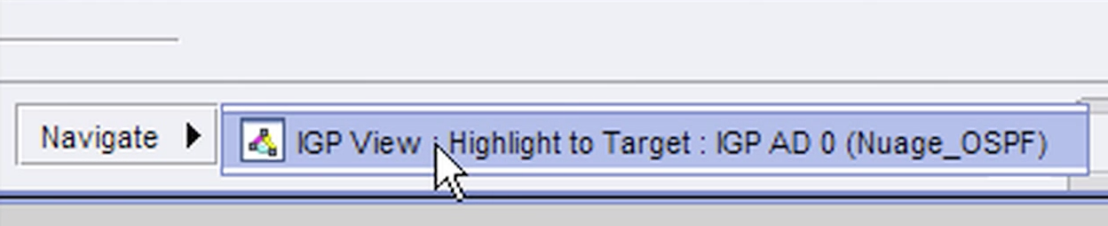
On the picture below you can see the virtual overlay service path on top of the physical network.
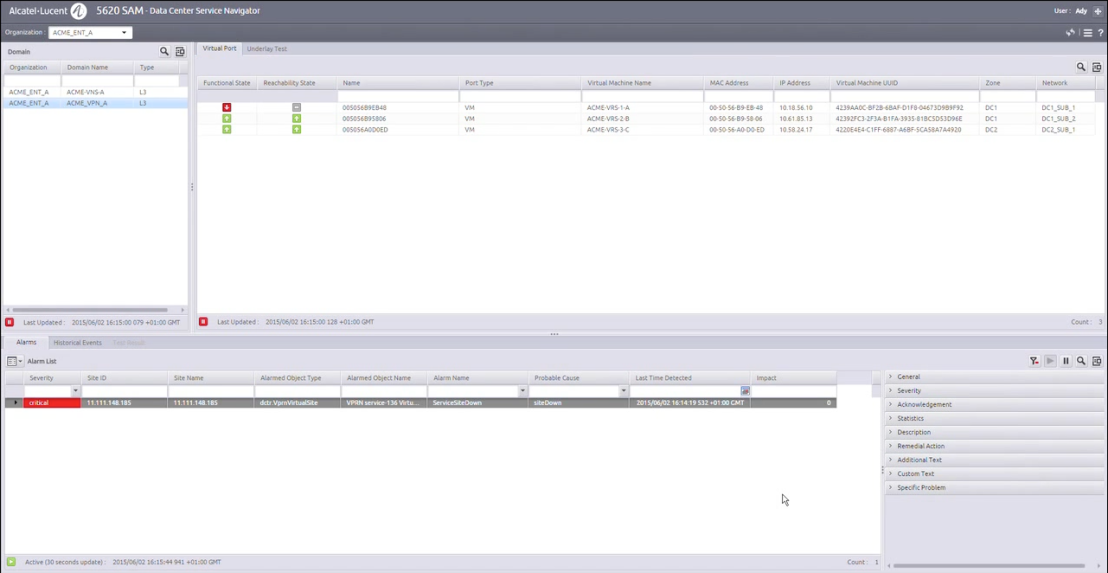
As mentioned before there is also the option to use a Web based GUI if you don’t like a Java based client (ahem 😉 ) In the example below we are looking at the VRSs (virtual switches) inside the L3 VPRN construct, so you can see where the virtual machines connect to the Open vSwitch based VRS on each hypervisor host.

You also have an inventory view allowing you to search on all objects in the physical and virtual space.
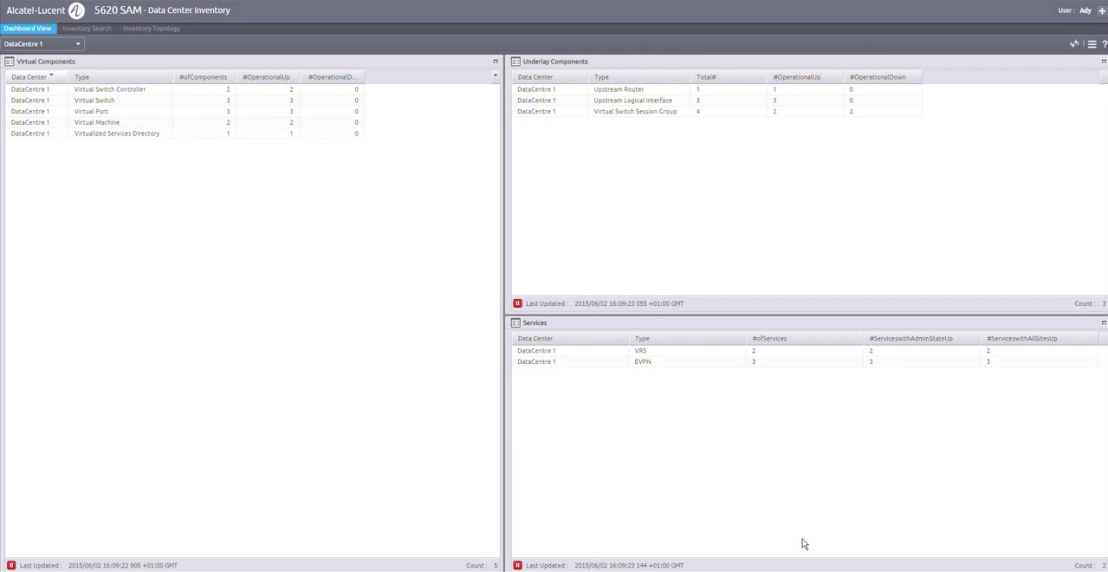
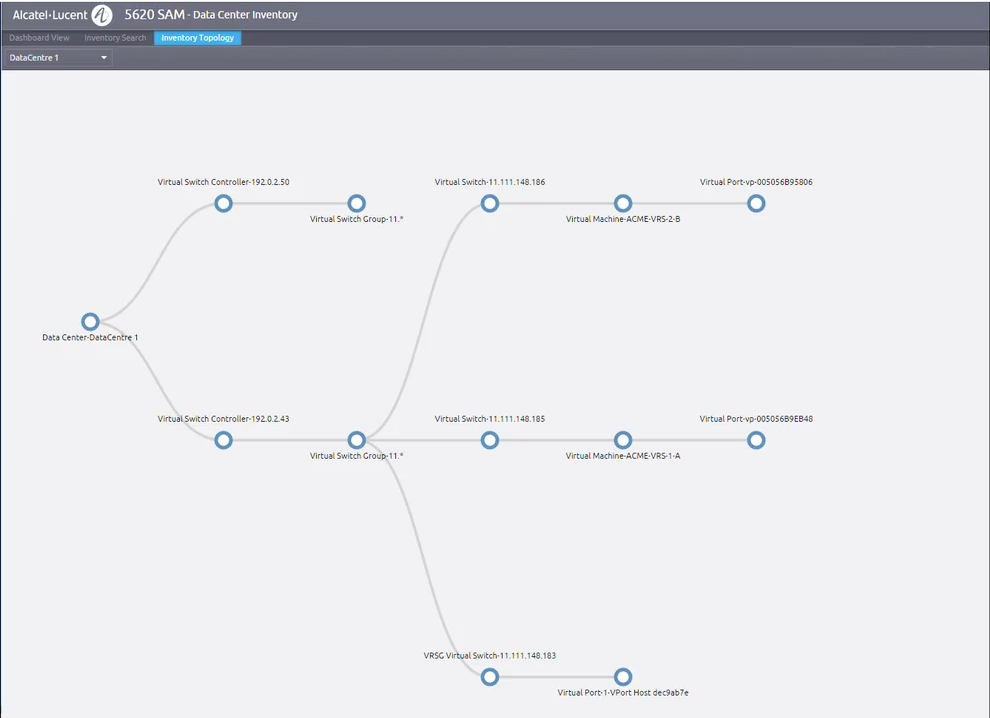
You can also look at the inventory topology.
Fault correlation
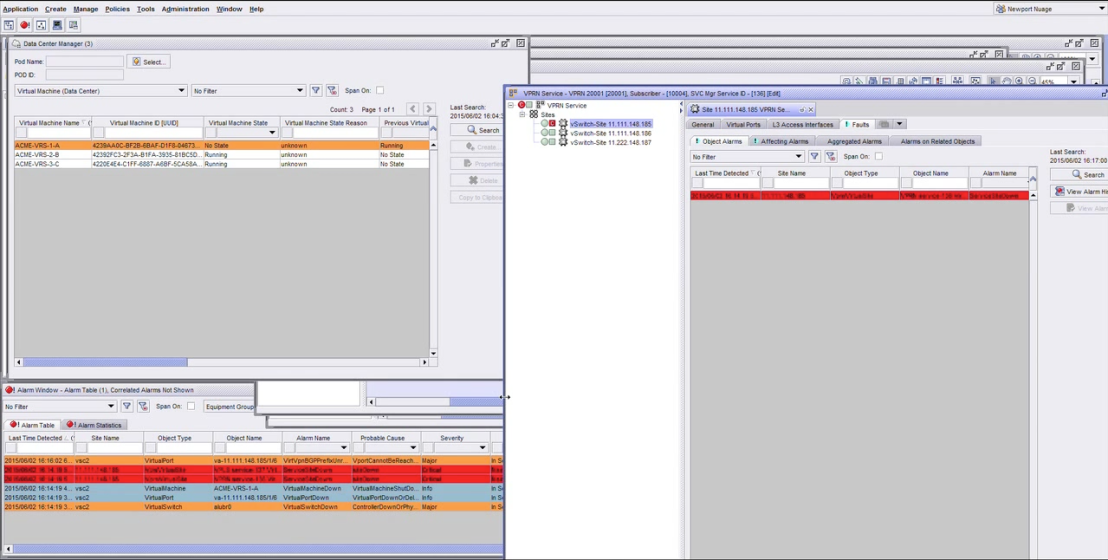
One of the powerful options you now have is that you can perform fault correlation between the physical and virtual constructs. So in the example below a switch failure is introduced and you can see the impact on overlay and underlay, including, and up to the virtual machine level.
Pictured below is the overview on the Web Gui showing the alarm that has been raised, the impact and probably cause.
Same type of indication on the Java client depicted below.
For additional information and a demo of how this works I recommended having a look at the recorded Tech Field Day Extra session from ONUG Spring 2015 here.